Clouds and Complexity: Viewing the Earth from Space
- Kent Moore
Satellites have been used for over 40 years to provide data and images of the Earth’s surface and atmosphere. These images are from a pair of NASA polar-orbiting satellites, Terra and Aqua, that fly the Moderate Resolution Imaging Spectroradiometer (MODIS) instrument. These satellites provide coverage of the entire globe, unlike geostationary satellites that image only the tropics and mid-latitudes. As a result, polar-orbiting satellites are an important source of data on the high-latitude climate system.
MODIS provides images at a number of different wavelengths that can be combined together in such a way as to mimic what the human eye would see. Thus clouds, snow, and sea ice appear white, while the ocean is dark and vegetation is green. It can be a challenge to distinguish between snow-covered surfaces, sea ice, and clouds, but over time subtleties appear that allow one to make a distinction.
Polar-orbiting satellites image the Earth in narrow swaths and some of the images show multiple swaths, resulting in the appearance of seams. The time between swaths is approximately 90 minutes, and these seams are of interest as they document the dynamic nature of the Earth’s cloud cover. The repeated coverage that these satellites provide allows scientists to document the changes that are occurring as the Earth warms. This is especially important for the Arctic, a region undergoing dramatic changes at an accelerated rate compared to the rest of the Earth.
As these examples show, “true-colour” satellite images provide a wealth of information on the climate system, as well as striking views of its beauty and complexity.
All images are from the NASA Worldview website (https://worldview.earthdata.nasa.gov) with additional processing by Professor Moore’s group in the Department of Chemical and Physical Sciences at the University of Toronto Mississauga.
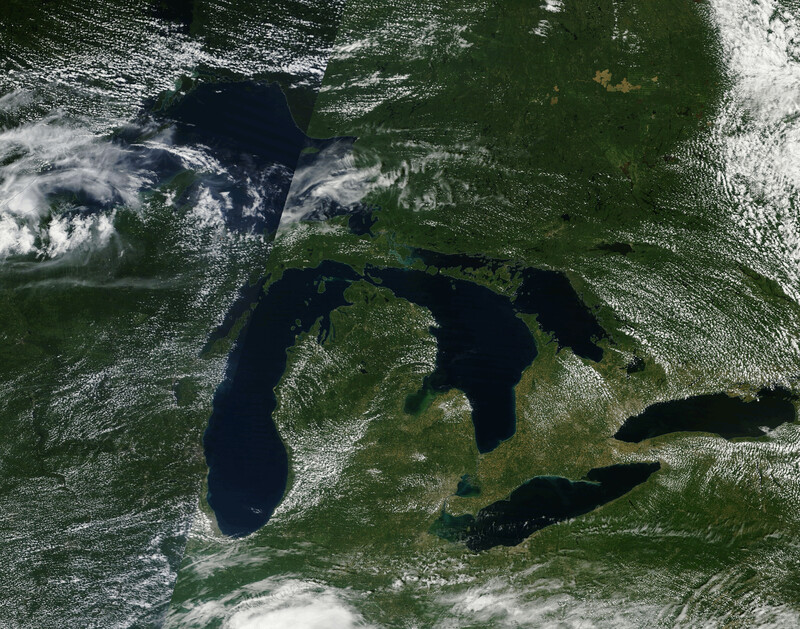
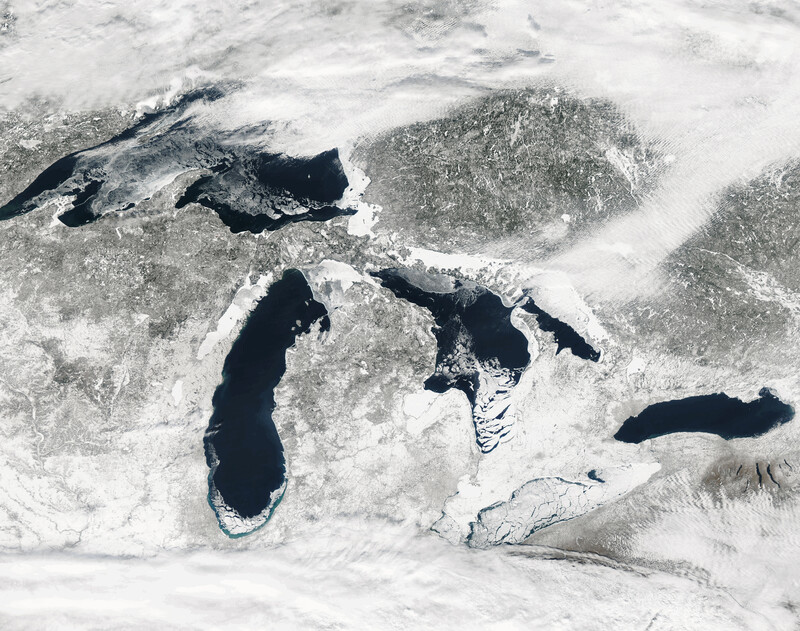
The Great Lakes regions experience dramatic changes between summer (upper) and winter (lower), and summer brings warmer temperatures and a verdant green landscape. Lake temperatures are typically cooler than nearby land, and as a result, clouds tend to develop over these warmer surfaces. They typically resemble puffy cotton balls, and are known as fair weather cumulus clouds. Winter’s colder temperatures result in the presence of snow and lake ice across the region—Lake Erie and Georgian Bay tend to be ice-covered, while Lake Ontario is usually not. During the winter, clouds tend to be associated with large-scale weather systems known as extra-tropical cyclones.
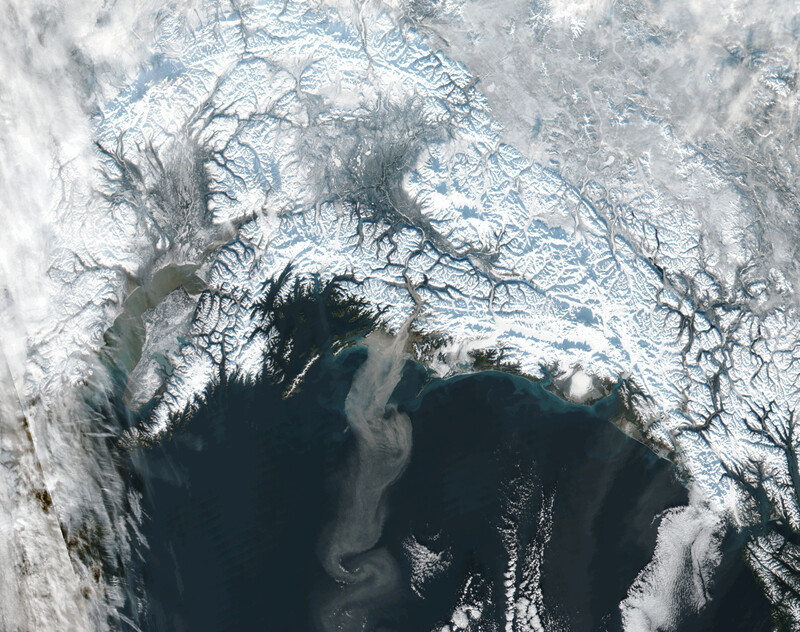
The Gulf of Alaska is a region of contrasts between the high mountains that surround it and the waters of the gulf. In this image from November 2017, the complex topography of the region is highlighted by the differences in snow cover between the mountaintops and the surrounding valleys. A plume of glacial dust can be seen extending from the mouth of the Copper River valley, one of the largest in the region. These plumes are the result of high winds that blow down the valley, and are an important source of nutrients for the highly productive marine ecosystem of the region.
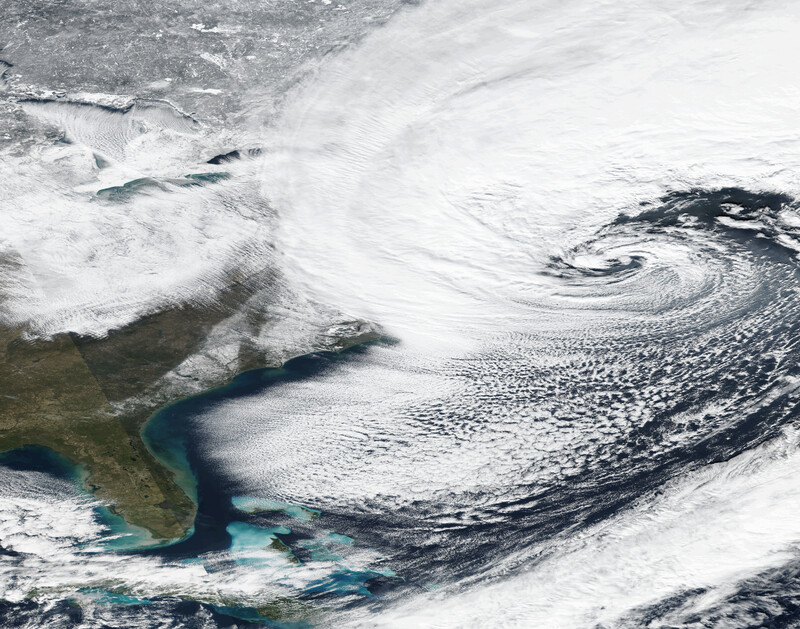
A nor’easter moves up the eastern seaboard of North America on 4 January 2018. These extra-tropical cyclones typically take on a “comma” shape, the result of the counter-clockwise winds associated with these storms. Ahead of the storm, the transport of warm air northwards results in extensive cloud cover that resembles a comma. Behind the storm, cold air streams out over the warm waters of the Gulf Stream as well as Lake Superior, leading to the distinctive linear cloud bands indicative of the transfer of heat from ocean or lake surface to the atmosphere. Over the land, a band of snow can be seen extending northwards from Georgia, in stark contrast to the green vegetation to the south and west.
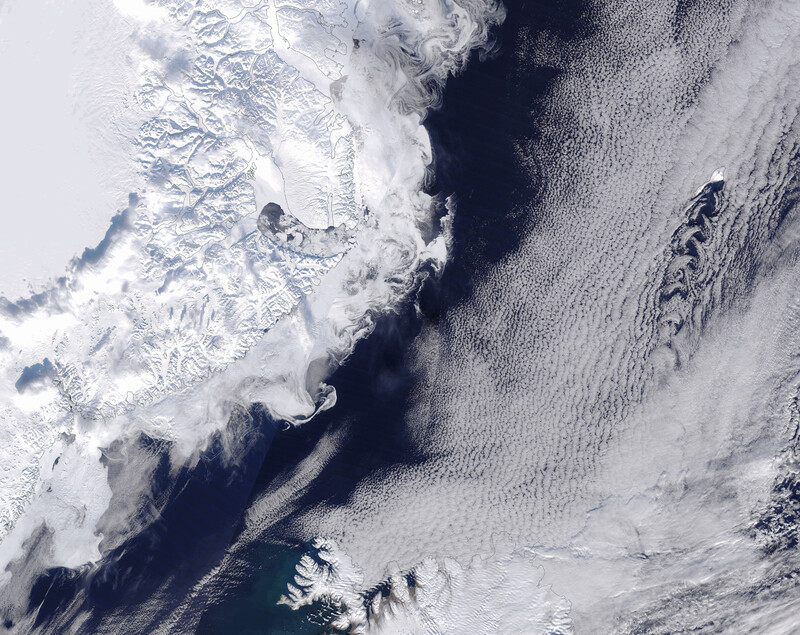
A winter’s view of the Denmark Strait. Complex swirls of sea ice are present along the east Greenland coast. Onshore, the mountains of the coastal region stand in juxtaposition to the smooth glaciers of the central ice cap. Offshore, a band of clouds can be seen extending south towards northern Iceland. Jan Mayen, a volcanic island that rises to a height of 2,000 metres, obstructs this flow, resulting in a striking pattern in the clouds known as a von Kármán vortex street.
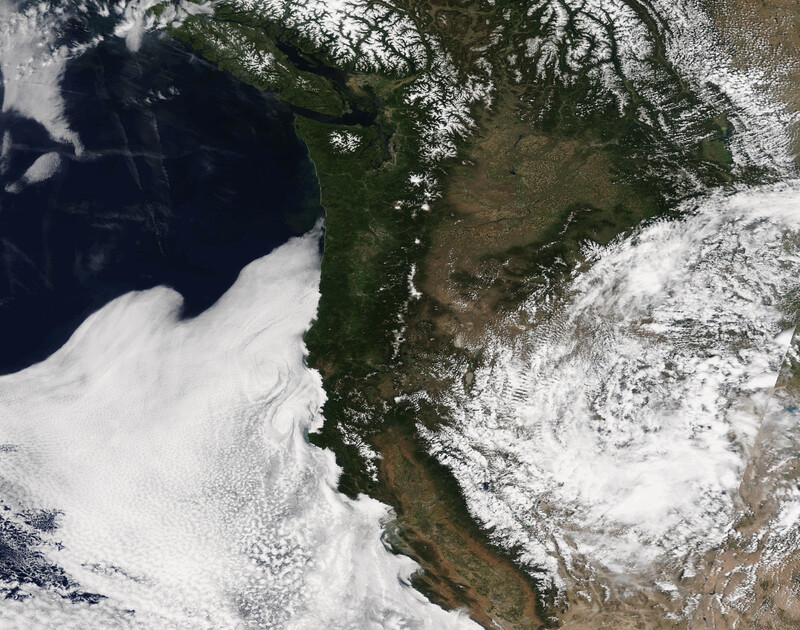
Spring along the west coast of North America. Winter snow can still be seen along the coastal mountains of British Columbia and Washington State, as well as the volcanoes of the Cascades and the Sierra Nevada. Offshore, a band of stratiform clouds with complex embedded structures hugs the coast of Oregon and California, sometimes spilling inland into regions of low topography. Over the high plains, thunderstorms have formed—the result of warm surface temperatures.
Kent Moore is a Professor of Physics and Vice-Principal of Research at the University of Toronto Mississauga. Moore has a PhD in Geophysical Fluid Dynamics from Princeton University, and his research interests include geophysical fluid dynamics, mesoscale meteorology, and polar meteorology. He has published over 160 peer-reviewed research papers and has played a leadership role in a number of national and international research collaborations focused on improving our understanding of the interactions that occur with the climate system. Professor Moore has also trained over forty undergraduate students, graduate students, and post-doctoral fellows who have gone onto varied careers in the financial services industry, government, and academia.
See Connections ⤴