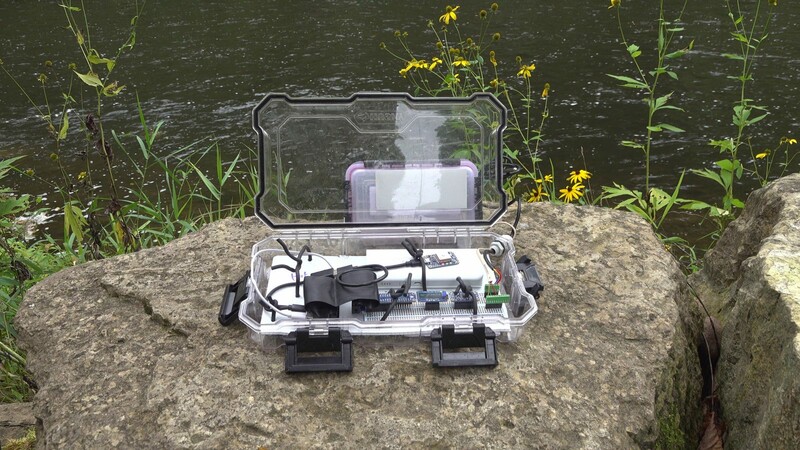
Drawing on their experience with DIY data collection and analysis, Ellen Graham and John Kim lead participants in a workshop on visualizing data. Participants will use published environmental data to build a collaborative map of seen and unseen emissions in Mississauga. In step with Kim’s analyses of the politics and ethics of data visualization, this workshop will query: what can data visualization make apparent? What can it draw into collective attention and action? What dimensions of activism can citizen sensing and data visualization open up?
This workshop will be held using R Statistical Software and Rstudio software, both free and open source programs. Participants will be asked to install several software packages in advance. This workshop is suitable for beginner-level programmers, and no past programming experience is necessary.
Presenter Biographies
See Connections ⤴
John Kim is a professor of Media and Cultural Studies at Macalester College in St. Paul, Minnesota. A theorist and practitioner of new media, he has published widely, including a book Rupture of the Virtual (2016), journal articles, and other print publications. John has also exhibited interactive art, sculpture, video games, and software in galleries and festivals around the world, including MassMOCA, Massachusetts; Dia Center for the Arts, New York City; the Walker Art Center, Minneapolis, Minnesota; and Northern Spark arts festival, St. Paul. With his art design group, Futures North, John has created work at the intersection of environmental representation and data spatialization. Futures North recently created a public art sculpture about the anthropogenic history of the Mississippi River. John was involved in the Mississippi. An Anthropocene River project (2018–2019) and was fortunate to have the opportunity to canoe from the headwaters to the Gulf of Mexico conducting research.
See Connections ⤴
Reading Open Data: Data Visualization, Citizen Science, and Collective Action
Live workshop: Sunday, January 24, 2021, 11am
- Facilitators
- Ellen Graham
- John Kim

The Blackwood
University of Toronto Mississauga
3359 Mississauga Road
Mississauga, ON L5L 1C6
[email protected]
(905) 828-3789
The galleries are currently closed, reopening March 27. Hours of operation: Monday–Saturday, 12–5pm.
Facebook | Twitter | Instagram
Sign up to receive our newsletter.
The Blackwood is situated on the Territory of the Mississaugas of the Credit, Seneca, and Huron-Wendat.